Oscilloscope Screenshot OCR: A Practical Guide to Searchable Lab Notes
Turn oscilloscope screenshots into searchable lab records without confusing measurements, channel labels, graticules, or annotations. Includes capture, cleanup, OCR, and review steps.
Oscilloscope Screenshot OCR: A Practical Guide to Searchable Lab Notes
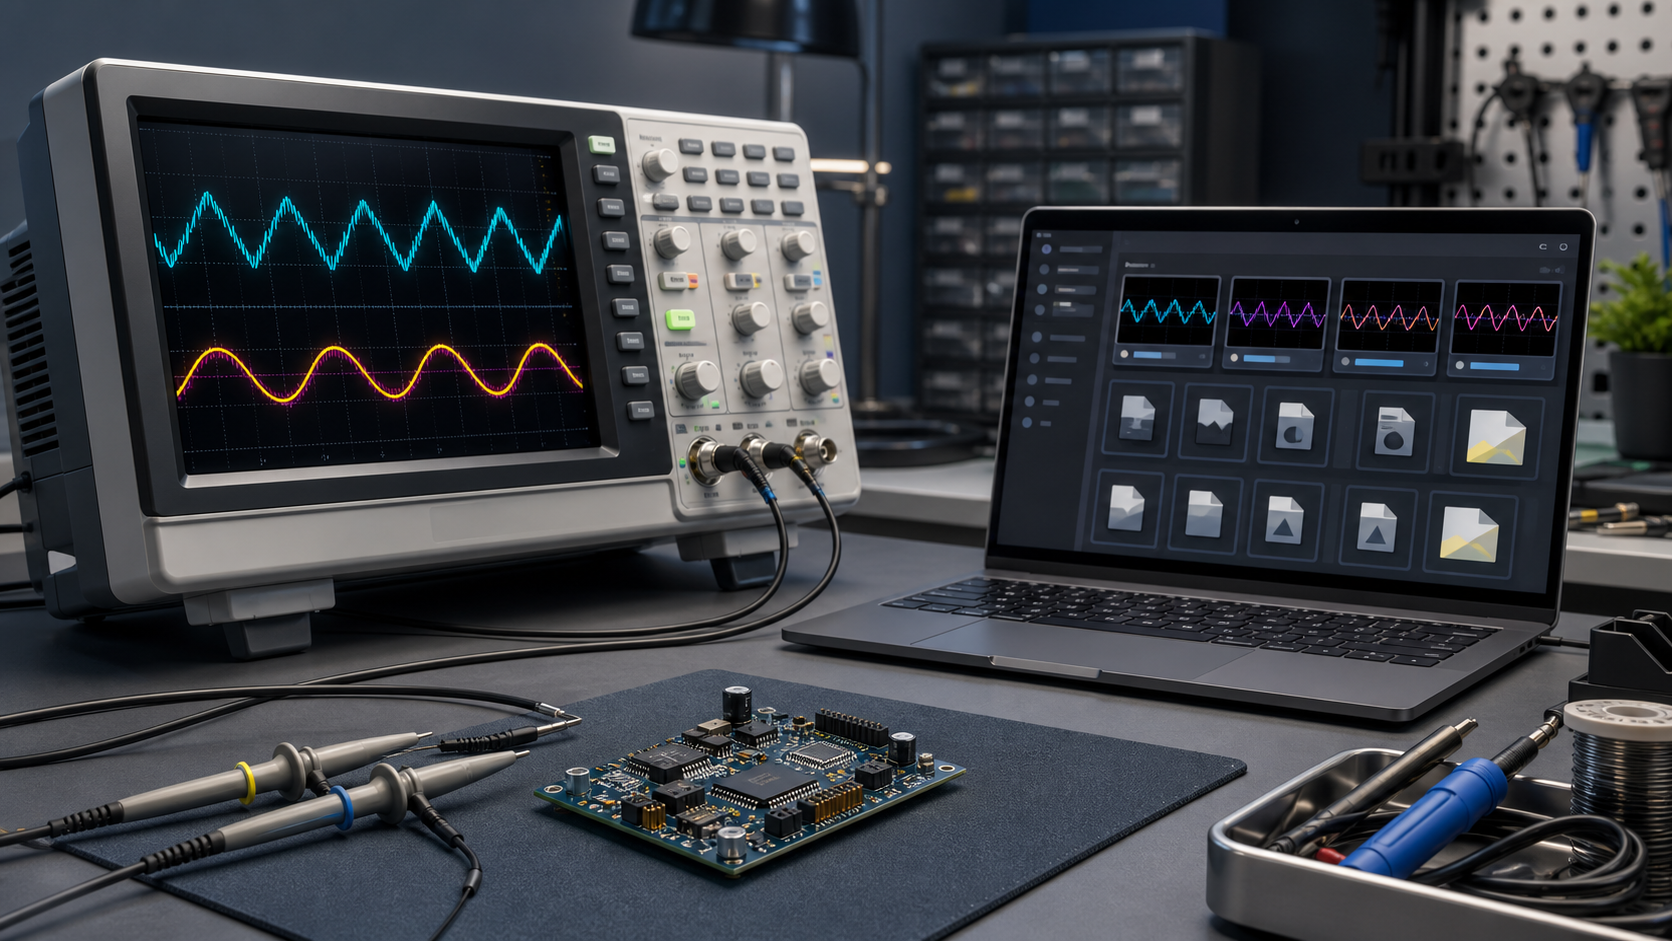
Digital oscilloscopes can save screenshots in seconds, yet those images often become poor long-term records. A folder may contain hundreds of nearly identical captures named with automatic counters. The waveform remains visible, but the values that make it meaningful—time base, channel scale, trigger level, frequency, rise time, and probe attenuation—are trapped inside pixels.
Optical character recognition can turn those screen captures into searchable notes. The difficult part is that an oscilloscope display is not a clean document. It combines small text, colored traces, grid lines, icons, abbreviations, decimal values, and overlapping measurement panels. Ordinary OCR settings can mistake a graticule for punctuation, drop engineering prefixes, or merge values from unrelated channels.
This guide presents a practical method for preparing oscilloscope screenshots, extracting useful text, and reviewing measurements without treating OCR output as authoritative instrument data. It is suited to repair benches, teaching laboratories, hardware development teams, amateur radio projects, and small electronics labs that need better records without building a custom data pipeline.
Decide what the searchable record must contain
Start by defining what someone should be able to find months later. Extracting every visible character usually creates noisy records. A smaller, deliberate set of fields is more useful.
For a basic capture, consider recording:
- Project, board, or device identifier
- Test point or signal name
- Instrument model if several scopes are used
- Capture date
- Channel scale and coupling
- Probe ratio
- Horizontal time base
- Trigger source, mode, slope, and level
- Automatic measurements shown on screen
- Operator note or test condition
- Original screenshot filename
The waveform itself still belongs in the record. OCR supplements the image; it does not replace it. Keep the source capture even after making a cleaned OCR copy.
A motor-controller investigation might need searches for gate, CH2, 20 ns, and overshoot. An audio repair archive may care more about 1 kHz, AC coupling, THD test, and the amplifier model. Choose fields around the questions people will actually ask.
Why oscilloscope screens confuse OCR
An oscilloscope interface contains several visual systems at once. The measurement panel behaves somewhat like a table, while the graticule resembles graph paper. Channel badges may use reversed text, and annotations can float directly over traces.
Common recognition errors include:
| Screen feature | Typical OCR error | Practical consequence |
|---|---|---|
| Graticule lines | Read as 1, I, brackets, or minus signs | Extra characters pollute values |
| Colored text on black | Low-confidence or missing characters | Channel settings disappear |
Engineering prefix µ | Read as u, p, m, or omitted | A value can change by orders of magnitude |
| Decimal point | Lost against a grid line | 2.50 V becomes 250 V |
| Channel badge | Number merged with nearby scale | Wrong channel association |
| Waveform crossing text | Characters split or joined | Measurement labels become unreliable |
| Status icons | Read as letters or punctuation | Search index gains meaningless tokens |
| Anti-aliased UI text | Thin strokes vanish after compression | Similar characters become ambiguous |
These errors matter because oscilloscope text is dense with units. Confusing mV with V, or ns with ms, is not a cosmetic problem. Treat every extracted measurement as a transcription that requires comparison with the original display.
Prefer native screenshots over camera photos
If the instrument can export a screenshot to USB, network storage, or a companion application, use that file. Native captures avoid glare, moiré patterns, perspective distortion, and focus errors. They also preserve the interface at its original pixel dimensions.
Before a test session, check whether the scope can:
- Save PNG or another lossless format.
- Include or exclude menus and measurement panels.
- use a predictable filename prefix.
- Save waveform data separately as CSV or a proprietary trace file.
- Capture the full display rather than only the plot area.
When numerical accuracy matters, save the waveform data or instrument setup alongside the screenshot. A visual capture is excellent context, but it is not a substitute for exported samples or a saved setup file.
Camera photos remain useful when USB access is restricted, the instrument is isolated, or the screen is part of a larger bench-state photograph. In those cases, capture quality becomes especially important.
Build a repeatable capture station
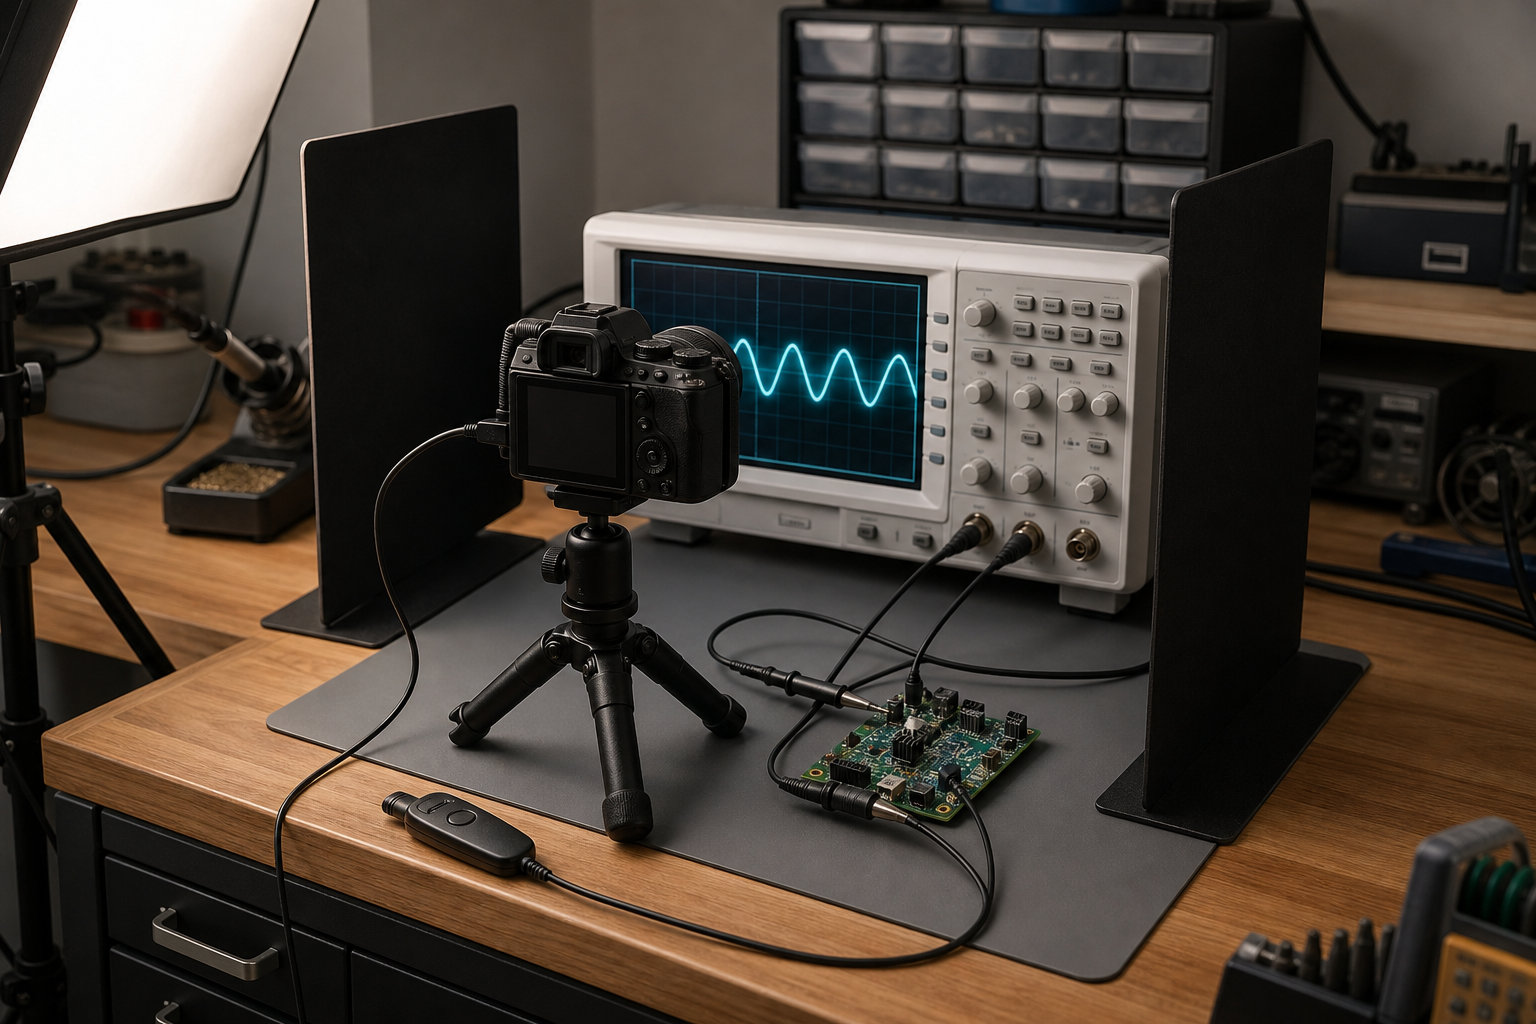
Position the camera square to the display. Even a small horizontal angle makes text on one side smaller than text on the other. A compact tripod, articulated arm, or fixed phone clamp helps preserve alignment between sessions.
Use the following capture checklist:
- Clean the display with a material approved for its surface.
- Dim overhead lights that produce reflections.
- Shield bright bench lamps with flags or reposition them.
- Fill most of the camera frame with the display.
- Lock focus on interface text, not the waveform glow.
- Use the lowest practical ISO to control color noise.
- Avoid digital zoom.
- Capture one image with the whole instrument when physical configuration matters.
- Capture a second, tighter image for OCR.
- Review small prefixes and decimal points before dismantling the test.
LCD refresh and camera shutter timing can produce dark bands. If bands appear, try a different shutter speed or enable an anti-flicker setting. Do not assume that a sharp enclosure means the screen content is sharp; inspect the smallest measurement text at full size.
A consistent setup also improves comparisons. If every photograph has the same orientation and approximate scale, later cropping and review take much less effort.
Preserve a source, an OCR copy, and extracted text
A durable lab record should separate evidence from derived material. A simple three-part structure works well:
- Source image: untouched screenshot or camera original
- OCR image: cropped and adjusted copy prepared for recognition
- Text record: extracted text plus corrections and contextual notes
Never overwrite the source while experimenting with contrast or background cleanup. Some adjustments that improve one panel can erase faint status information elsewhere.
Use filenames that remain understandable outside a particular application. For example:
motorA_gate_TP7_2026-07-23_capture-003_source.png
motorA_gate_TP7_2026-07-23_capture-003_ocr.png
motorA_gate_TP7_2026-07-23_capture-003_notes.md
Avoid placing the only description in a folder name. Files are often copied, attached to tickets, or separated from their original directory.
Separate OCR zones before extraction
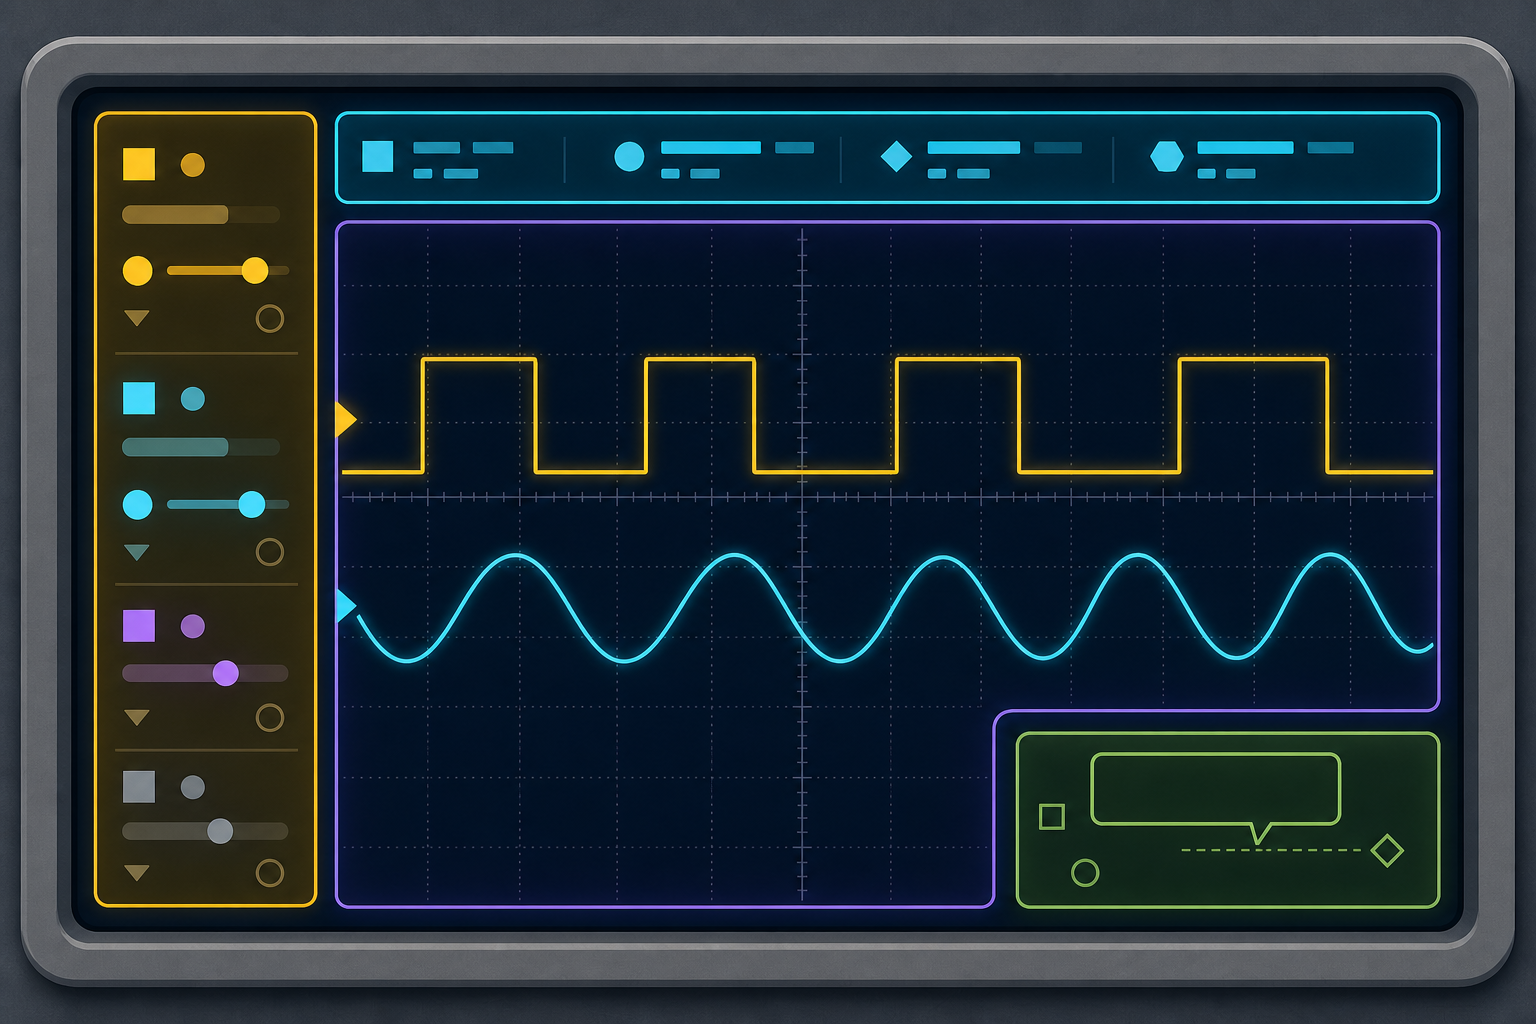
Trying to recognize the entire display in one pass is rarely optimal. Divide it into logical zones whose text shares a layout and purpose.
Measurement panel
This area often contains label-value-unit rows. Crop tightly enough to exclude most waveform traces, but keep complete labels and channel indicators. Table-oriented OCR may work well when rows are clearly separated.
Channel and horizontal settings
Channel scale, offset, coupling, bandwidth, and time-base values frequently sit along the screen edges. Extract these regions separately so the OCR engine does not guess their reading order relative to measurements.
Trigger settings
Trigger source and level can appear in a top status bar, side menu, or lower panel. Preserve nearby icons only when they are needed to interpret slope or mode. Otherwise, icons may add recognition noise.
Operator annotations
Scope labels such as test-point names may appear over the plot. Crop each annotation with a small margin. If a waveform crosses the characters, manual transcription may be faster and more reliable than aggressive editing.
Region-based extraction also makes review easier. A reviewer can compare one measurement block at a time rather than finding values inside a long, disordered text dump.
Prepare the OCR copy without destroying evidence
Begin by cropping unused bezel, reflections, and surrounding bench clutter. The image resizing tool can produce a larger working copy when the original interface text is extremely small. Upscaling does not recover missing detail, but it can give OCR engines a more usable character grid.
Use moderate enlargement, such as two or three times the original dimensions, and inspect the result at 100 percent. Excessive enlargement can turn anti-aliased edges into soft shapes without adding information.
Next, test a few controlled adjustments:
- Increase local contrast slightly.
- Lift dark interface text only if it is disappearing into the background.
- Reduce color noise in camera photographs.
- Apply restrained sharpening to text edges.
- Correct perspective before cropping individual panels.
- Keep a color version whenever channel identity depends on color.
The AI photo editor can help with restrained cleanup of a photographed display, especially when there is peripheral clutter or uneven illumination. Avoid generative reconstruction over measurement text. If an editor invents or reshapes characters, the adjusted image is no longer a faithful transcription source.
Do not automatically convert every capture to pure black and white. Thresholding can simplify a high-contrast menu, but it may erase colored channel text or merge grid lines with characters. Create separate variants when necessary: a color crop for channel identity and a grayscale crop for a measurement table.
Run OCR as a structured extraction pass
Upload each prepared region to an image OCR tool and retain the raw result before correcting it. Raw output helps distinguish recognition errors from later editing mistakes.
For each crop, record:
- Region name
- OCR output
- Corrected transcription
- Confidence or review status
- Link or filename for the source image
Do not depend on the OCR engine's reading order. Rearrange output into a consistent schema after comparing it with the screen.
A useful text record might look like this:
Capture ID: motorA_gate_TP7_003
Signal: high-side gate
CH1: gate voltage, 5.00 V/div, DC, 10x probe
Horizontal: 20.0 ns/div
Trigger: CH1, rising edge, 6.2 V
Measurements:
- Rise time: 18.4 ns
- Maximum: 12.8 V
- Overshoot: review from source image
Condition: 24 V input, no mechanical load
Review status: units checked against source
The phrase review from source image is better than a confident but uncertain number. Searchable records should expose ambiguity rather than conceal it.
Audit units, prefixes, decimals, and channel identity
Review technical values in a fixed order. This reduces the chance that a visually plausible number escapes scrutiny.
Check the label-value-unit combination
A value without its label is dangerous. Confirm that 18.4 ns belongs to rise time rather than delay, period, or another row. Make sure the unit is attached to the correct value after OCR reordering.
Verify engineering prefixes
Inspect every p, n, µ, m, k, and M. Normalize symbols for searching only after preserving the displayed form. You might store both µs and the ASCII-friendly alias us, but do not silently change the underlying magnitude.
Confirm decimal placement
Zoom into the source and locate the actual decimal point. A grid intersection, compression artifact, or colored pixel can resemble punctuation. If the point is not visible, mark the value as uncertain.
Match values to channels
Channel colors are helpful to a human but may vanish in grayscale OCR. Include explicit channel identifiers in the corrected record. When two channels share similar settings, compare their positions and badges carefully.
Compare related measurements
Use physical relationships as warning signals, not as permission to rewrite data. If a displayed frequency and period differ dramatically, check both against the image. A consistency check can reveal an OCR error, but it cannot prove which reading is correct.
Choose image formats deliberately
Native scope screenshots are commonly stored as PNG because flat interface graphics and sharp text compress well without lossy artifacts. Keep PNG for the source unless the instrument supplies another original format.
If a camera photograph arrives as JPEG, preserve that original. Converting it to PNG will not reverse existing compression. A PNG derivative may still be useful after cropping and annotation because it avoids another lossy save.
The image conversion tool is useful when a lab system requires a consistent derivative format. Document the conversion and retain the original file. Avoid repeated JPEG saves, which can create halos around thin text, graticules, and colored traces.
Compression should happen only after OCR and review. If you need smaller copies for a ticket or knowledge base, use the image compression tool and compare small units, decimal points, and trace intersections before accepting the result. Archive copies and distribution copies can have different size targets.
Assemble a compact test record
A screenshot becomes much more valuable when placed beside context. For each important capture, include the test objective, device state, probe location, and any setup detail that cannot be inferred from the display.
A concise record can contain:
| Field | Example content |
|---|---|
| Capture ID | Stable identifier matching filenames |
| Device state | Input voltage, load, firmware, temperature |
| Probe placement | Test point and reference location |
| Scope configuration | Channels, probes, time base, trigger |
| Extracted measurements | Reviewed label-value-unit entries |
| Interpretation | What the capture appears to show |
| Limitations | Glare, clipping, uncertain prefix, missing setup data |
| Attachments | Source, OCR copy, data export, setup file |
When several captures form a report, combine copies with notes using image to PDF. Keep the individual source files too. A PDF is convenient for review and handoff, while separate images and text remain easier to search, reuse, and validate.
Arrange the report in test order rather than filename order if automatic counters reset between sessions. Add visible capture IDs in captions outside the source image; do not draw over the original display.
Handle annotations without contaminating the source
Annotations can clarify probes, ringing, glitches, or timing relationships, but they should live on a derivative copy. Use arrows and callouts with enough margin that they do not cover channel settings or measurement panels.
Maintain two versions:
- A clean source or faithful crop for verification
- An annotated copy for explanation
If OCR is run after annotation, it may read callout text as though it came from the instrument. Extract screen text first, then add explanatory labels. Clearly distinguish instrument-displayed measurements from values calculated or written by the operator.
For teaching material, this separation is especially important. Students should be able to tell which evidence was present during acquisition and which interpretation was added later.
Common approaches that fail
Recognizing the full screen once
A single OCR pass often mixes top status text, bottom channel settings, and side measurements. Region-based passes produce cleaner associations.
Enlarging after heavy JPEG compression
Upscaling makes artifacts larger too. Return to the native screenshot or earliest camera original whenever possible.
Removing all color
Channel identity and warning states may be encoded by color. Preserve a color reference even if a grayscale derivative recognizes text more accurately.
Trusting plausible values
Technical OCR errors often look reasonable. 5.00 V and 500 V both resemble valid electrical measurements in isolation. Review characters against the source.
Editing the only copy
Aggressive cleanup can erase faint symbols and alter edges. Keep the untouched acquisition as the evidence layer.
Treating screenshots as raw measurement data
A screenshot shows the instrument's presentation at one moment. It may omit acquisition settings, sample arrays, calibration state, or hidden measurements. Export trace data and setup files when repeatable analysis is required.
Final quality-control checklist
Before filing or sharing an oscilloscope record, confirm that:
- The untouched source capture is retained.
- The screenshot has a stable, descriptive identifier.
- Project, signal, test point, and device state are recorded.
- OCR was performed on logical screen regions.
- Labels remain paired with the correct values and units.
- Engineering prefixes were checked visually.
- Decimal points were verified at full resolution.
- Channel identity was not inferred from grayscale output alone.
- Trigger and time-base settings were reviewed.
- Uncertain values are marked rather than guessed.
- Any cleanup is stored as a derivative.
- Annotations do not cover original measurements.
- Compressed sharing copies remain readable.
- Raw waveform data or setup files are attached when the test requires them.
Make screenshots useful beyond the test bench
The goal is not to extract the largest possible block of text. It is to create a record in which a future reader can find the right capture, understand its conditions, and verify every important value against preserved evidence.
Native screenshots, region-based OCR, conservative cleanup, and systematic unit review solve most of the practical problems. Camera photographs can also work when they are aligned carefully and retained alongside transparent notes about their limitations.
Once capture IDs and reviewed fields are consistent, an archive of oscilloscope screens stops being a pile of anonymous waveforms. It becomes a searchable technical history that supports debugging, repair comparisons, lab teaching, and design decisions without pretending that OCR is the measurement instrument.