Oscilloscope Screen Photo Cleanup for Clear Service Reports
A practical guide to correcting glare, perspective, color, and compression in oscilloscope screen photos while preserving traces, measurements, and diagnostic context.
Oscilloscope Screen Photo Cleanup for Clear Service Reports
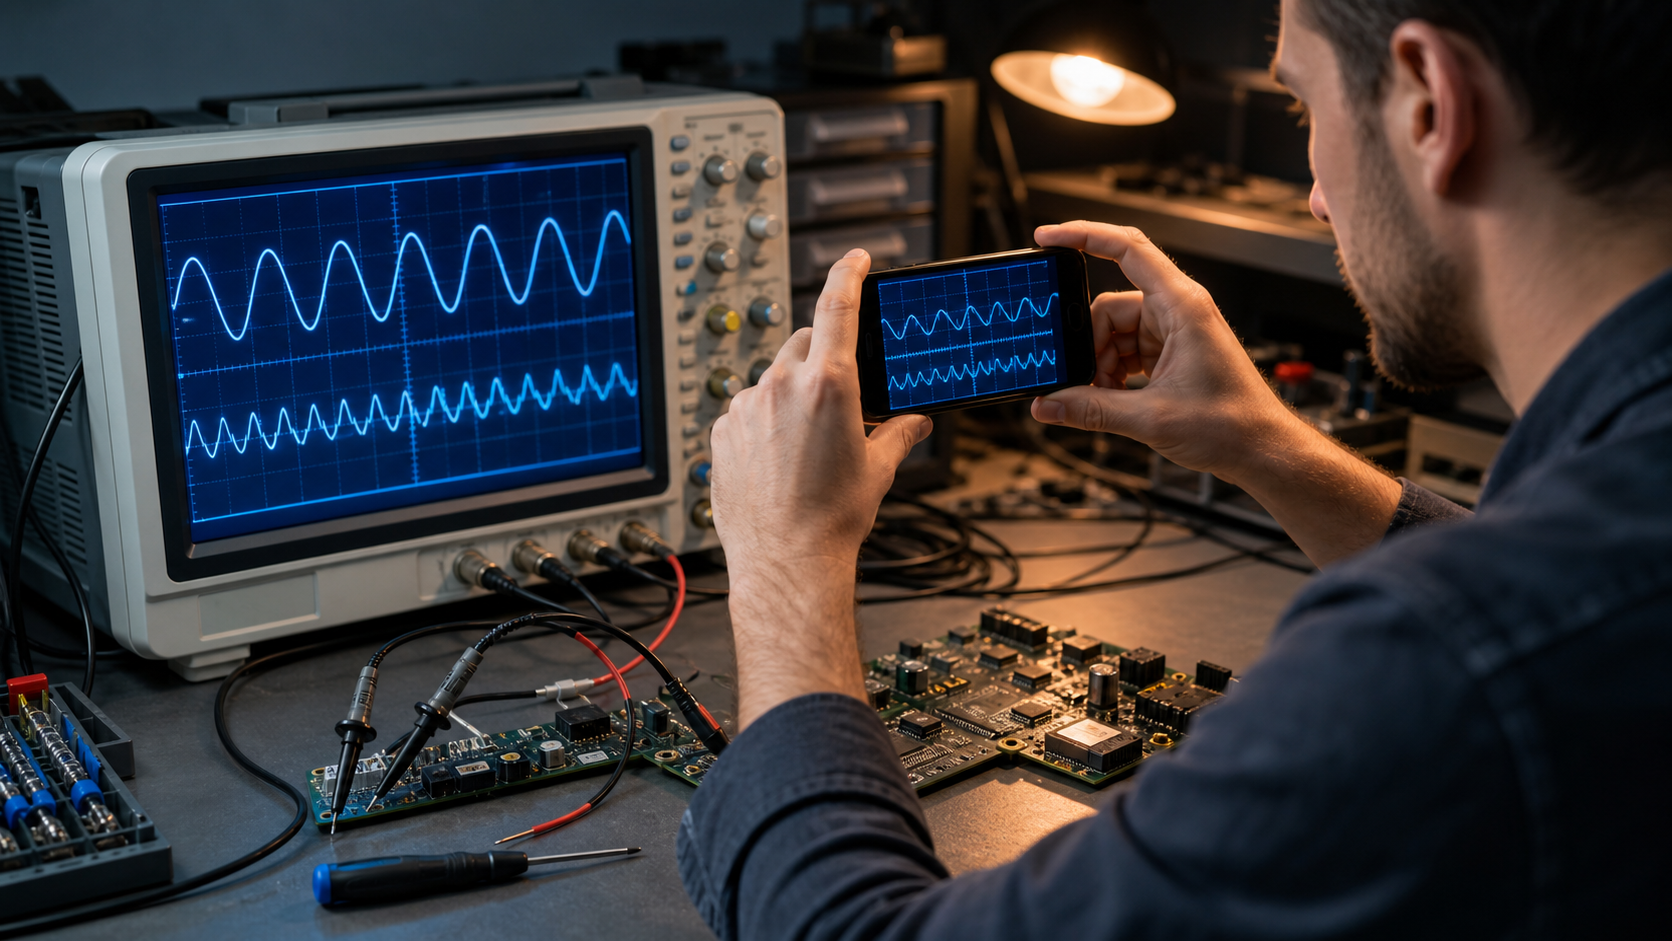
A photograph of an oscilloscope display can be more valuable than a paragraph of repair notes. It may preserve an intermittent fault, prove that a signal met its tolerance, or show the exact trigger and time-base settings used during diagnosis. Unfortunately, instrument screens are unusually easy to photograph badly.
Glossy covers reflect ceiling lights. Deep instrument housings force the camera off-axis. Automatic exposure can wash out a faint trace or turn the grid into a glowing rectangle. Phone software may sharpen the image so aggressively that a thin waveform develops false halos. By the time the photograph is compressed and inserted into a PDF, the evidence may be difficult to interpret.
The goal of cleanup is not to make the display look dramatic. It is to make the original measurement easier to inspect without changing its meaning. This guide presents a conservative method for preparing oscilloscope screen photos for repair records, field-service reports, quality investigations, and technical handoffs.
Decide what the photograph must prove
Before editing anything, identify the claim supported by the image. A useful photograph normally has one primary job:
- Show waveform shape, ringing, clipping, noise, or an intermittent event.
- Preserve numerical measurements displayed by the instrument.
- Record vertical scale, time base, trigger source, coupling, and probe ratio.
- Connect a captured signal to a particular unit, test point, or repair stage.
- Demonstrate a before-and-after result following component replacement or adjustment.
This decision controls how tightly you can crop and how much surrounding context should remain. A close crop may make a trace readable, but it can also remove the channel scale or acquisition state that gives the trace meaning.
For important findings, retain two versions: a context image showing the complete instrument and a display-focused image optimized for reading. Do not expect one photograph to serve both purposes perfectly.
Capture a stronger source image
Editing cannot restore measurement details that were never recorded. A few changes at the bench can prevent most serious problems.
Clean the display cover
Dust on a screen protector can resemble noise or isolated waveform points, especially in a compressed image. Use a cleaning method approved for the instrument and remove fingerprints before taking the photograph. Do not apply liquid directly to vents, controls, or an unknown screen coating.
Reduce reflections before changing exposure
Move portable lamps, close a nearby blind, or shade the screen with a piece of dark card positioned outside the frame. A technician wearing a bright shirt may appear as a large reflection, so neutral or dark clothing can help.
Avoid solving every reflection by making the room completely dark. Some ambient light is useful when the photograph must also show the probe connection or instrument controls.
Keep the camera parallel to the display
Position the phone or camera so its sensor is as parallel as practical to the screen. Use the grid as a guide: horizontal divisions should remain horizontal, and opposite sides of the display should appear similar in length.
If the instrument sits below eye level, move the camera instead of tilting it sharply. A small tripod, clamp, or stable shelf is useful when repeated captures need consistent framing.
Lock focus and exposure
Tap or focus on the grid rather than the instrument bezel. Reduce exposure until bright traces retain their color and thickness without merging into the grid. If the camera offers exposure lock, use it so before-and-after photographs remain comparable.
Take several frames. Display refresh, camera shutter timing, and pulse modulation can create dark bands or partial traces that are not visible to the eye. A short burst often provides at least one clean capture.
Preserve the untouched original
Copy the source image before cropping, enhancing, annotating, or converting it. Treat the original as evidence rather than as a disposable draft.
A practical file set might look like this:
unit-184_before_original.jpgunit-184_before_display-clean.jpgunit-184_before_annotated.pngunit-184_after_original.jpgunit-184_after_display-clean.jpg
Use names that connect the file to the asset, test stage, and capture order. Camera-generated names such as IMG_5831.jpg become ambiguous when several technicians contribute to the same report.
Keep editing reversible whenever possible. If a result is disputed, another reviewer should be able to compare the prepared image with the original capture.
Correct perspective without distorting the measurement grid
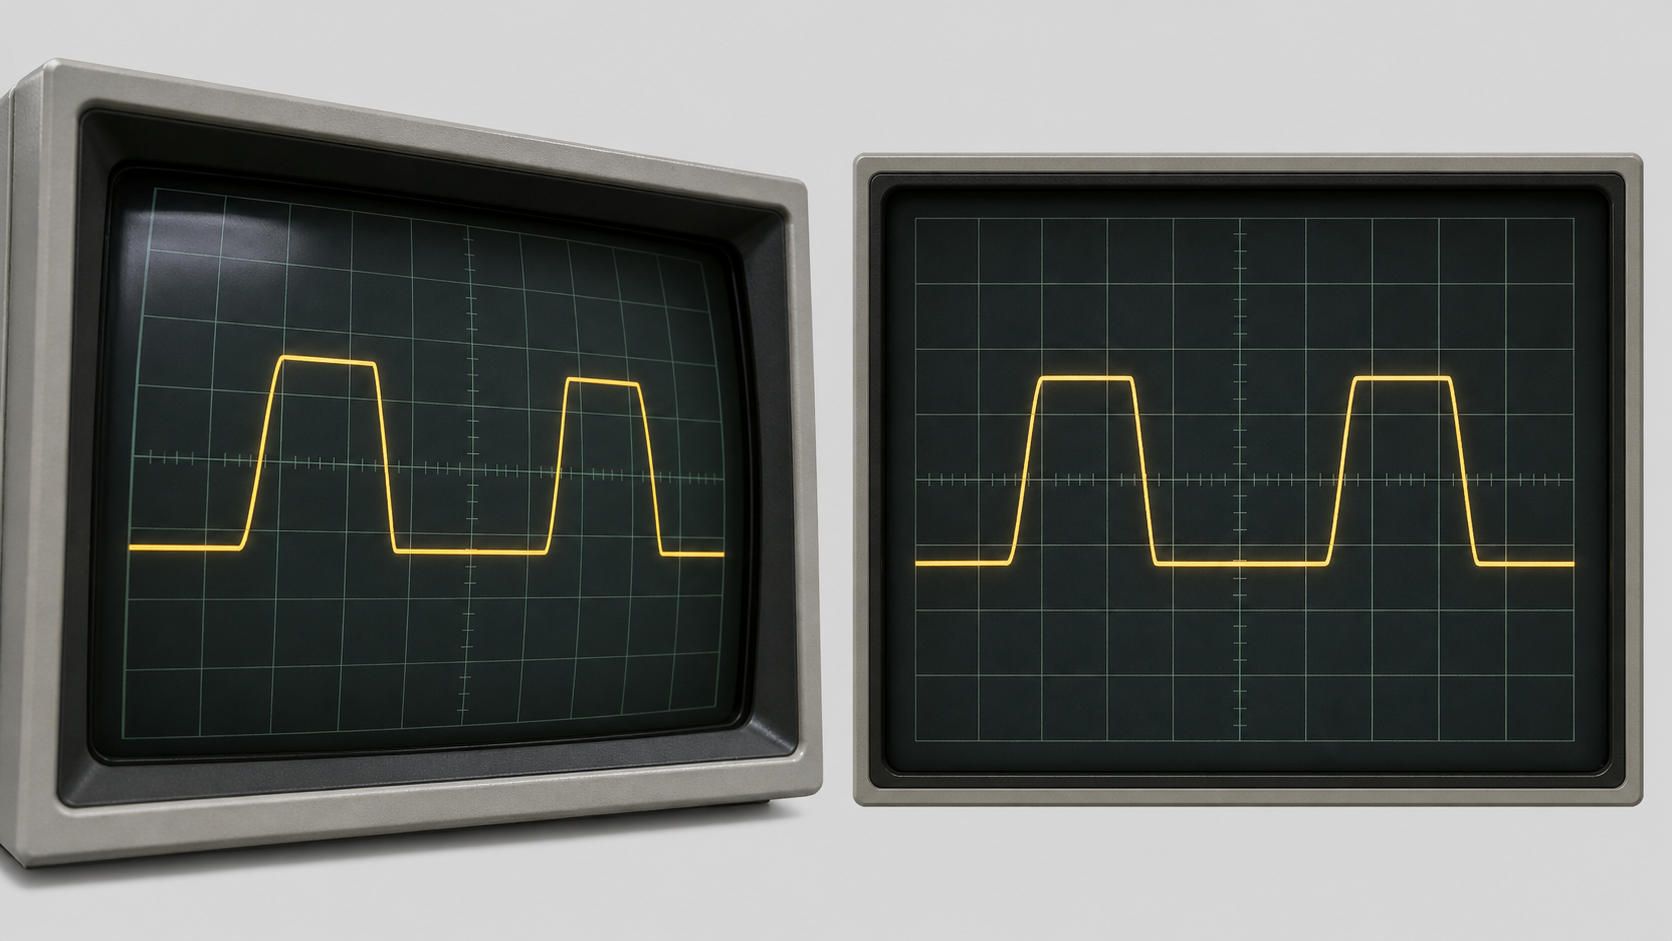
Perspective correction is often the most valuable edit because it makes divisions, cursors, and menu values easier to compare. It is also one of the easiest ways to introduce a misleading result.
Use the four visible corners of the active display area as correction anchors. The corrected image should make the screen rectangular, but it should not stretch one axis merely to fill a preferred canvas size.
Check the grid after correction:
- Horizontal grid lines should remain straight and parallel.
- Vertical lines should remain straight and parallel.
- Grid divisions should appear consistent across the display.
- Circles, icons, and control markers should not look unnaturally wide or narrow.
- The waveform should cross the same grid positions as it did in the original.
Leave a small amount of bezel around the corrected display when the exact screen boundary is uncertain. An overly tight crop can conceal correction errors and remove channel indicators near the edges.
Do not use free-form warping to make a trace look level or symmetrical. If the waveform slopes in the original capture, preserve that slope unless you can demonstrate that it resulted solely from camera geometry.
Control glare without erasing real signal detail
A reflection over an unused menu area may be reduced carefully. A reflection crossing a trace, cursor, measurement value, or clipping boundary requires much more restraint.
Start with global adjustments: modest highlight reduction, a slight exposure correction, and gentle local contrast. These are easier to explain and reproduce than painted reconstruction.
Avoid cloning or generative filling over measurement content. Such edits can invent a continuous line where the source contained a gap, remove an overshoot, or alter the apparent width of a pulse. If glare blocks a critical region, the defensible solution is usually to recapture the screen.
When recapture is impossible, keep the affected area visible and state in the report that a reflection obscures part of the display. Uncertainty documented honestly is more useful than a visually perfect but unreliable image.
Balance the grid and waveform trace
The display grid provides scale, but it should not overpower the signal. The trace carries the measurement, but increasing its contrast too far can change its apparent thickness.
Use restrained adjustments in this order:
- Correct overall exposure.
- Set black and white points without clipping either end.
- Make a small contrast adjustment.
- Adjust color only if channel identification is unclear.
- Apply minimal sharpening at the final output size.
Inspect thin features at 100 percent magnification. Look for bright or dark outlines around the trace, doubled edges, broken grid lines, and small menu characters that have become blocky.
A phone's automatic high-dynamic-range processing may produce uneven brightness around vivid traces. If the original JPEG already contains these artifacts, additional clarity or sharpening will amplify them. A slightly softer result is often more truthful.
When grayscale is acceptable
Grayscale can reduce file size and remove distracting color casts, but it is unsafe when color distinguishes channels, cursor types, pass/fail masks, or reference traces. Preserve color whenever hue carries diagnostic meaning.
If a report must be printed in monochrome, add explicit channel labels outside the image and verify that the traces remain distinguishable by position or line character. Do not assume a yellow and cyan pair will separate clearly on an office printer.
Crop for evidence, not appearance
A display-focused crop should retain everything required to interpret the measurement. Depending on the instrument, that can include:
- Channel scale and coupling.
- Probe attenuation.
- Horizontal time base.
- Trigger source, mode, and level.
- Acquisition mode and sample rate.
- Cursor or automated measurement values.
- Date, time, or file identifier shown by the instrument.
- A small portion of the bezel establishing the screen boundary.
Use a separate wider photograph to show the instrument model, asset label, probe routing, and device under test. This division produces more readable pages than one wide photograph with an illegibly small screen.
If the source image includes unrelated bench notes, faces, customer identifiers, or serial numbers outside the investigation, crop or redact them according to the organization's record policy. Keep the unredacted original only where access controls permit it.
Resize before applying final sharpening
Service-report templates often place an image at a fixed width. Supplying a twelve-megapixel photograph does not automatically improve the report; it may only enlarge the PDF and make transfer slower.
First determine the largest size at which the image will be viewed. For a display image occupying roughly half or all of a report page, preserve enough pixels for menu text and grid intersections to remain clear under normal zoom. You can use the image resize tool to create a consistent output size after perspective correction and cropping.
Resize only once near the end. Repeated downscaling and re-exporting gradually damage thin grid lines and small characters. Apply any final sharpening after resizing, because sharpening tuned for the source dimensions may look harsh at report size.
Choose a format that protects thin lines
Format selection matters because oscilloscope images contain fine lines, high-contrast characters, dark gradients, and sometimes colorful traces.
| Output need | Suitable choice | Main caution |
|---|---|---|
| Edited archival copy | PNG | Larger than necessary for photographic bezel areas |
| Compact report image | High-quality JPEG or WebP | Strong compression can break grids and create halos |
| Annotation layer with transparency | PNG | Confirm that the report software preserves transparency |
| Direct phone capture retained as evidence | Original JPEG or HEIC | Some recipients cannot open HEIC files |
PNG is a safe choice for a tightly cropped display because the grid and text remain crisp. JPEG may be more efficient for a wider bench photograph containing textures, cables, and shadows. Use the image conversion tool when the source format is inconvenient for the report system, but retain the original file alongside the converted copy.
When file size is important, test compression on the actual display crop rather than relying on a generic quality number. Open the result and inspect trace edges, measurement digits, decimal points, and closely spaced grid lines. The image compressor can help produce a lighter copy, but the smallest file is not the objective. The smallest file that preserves the evidence is.
Treat OCR as an assistant, not a measurement source
Optical character recognition can save time when transferring long instrument notes, timestamps, or repeated measurement labels. It is less reliable with segmented fonts, glowing text, decimal points, engineering prefixes, and characters positioned over a grid.
Use the image OCR tool to obtain a draft, then compare every extracted value with the display. Pay particular attention to:
- Decimal separators.
- Minus signs.
- Units such as mV, V, µs, ms, and MHz.
- Similar characters such as
0,O,1,I, andl. - Prefixes where a missed
morµchanges the value dramatically. - Channel numbers and mathematical trace labels.
Never replace the screen image with OCR text alone. Keep the photograph beside any transcribed values so a reviewer can verify the reading. If a value is too blurry to confirm visually, mark it as unreadable and consult the instrument's stored acquisition data if available.
Add annotations without covering the evidence
Annotations should direct attention, not redraw the finding. Use simple arrows, numbered callouts, or rectangles placed outside the trace whenever possible.
Maintain two versions: a clean corrected image and an annotated derivative. This lets another technician inspect the signal without interpretive overlays.
Good callouts identify a region and connect it to report text, such as “Area 2: intermittent overshoot after relay closure.” Weak callouts make unsupported conclusions or obscure the precise feature under discussion.
Avoid thick arrows, glowing outlines, novelty fonts, and opaque labels over the grid. If space is limited, put numbered markers around the screen edge and explain them in the caption. Use one annotation color that remains visible against the display and does not resemble an existing channel trace.
Build a compact evidence page for the service report
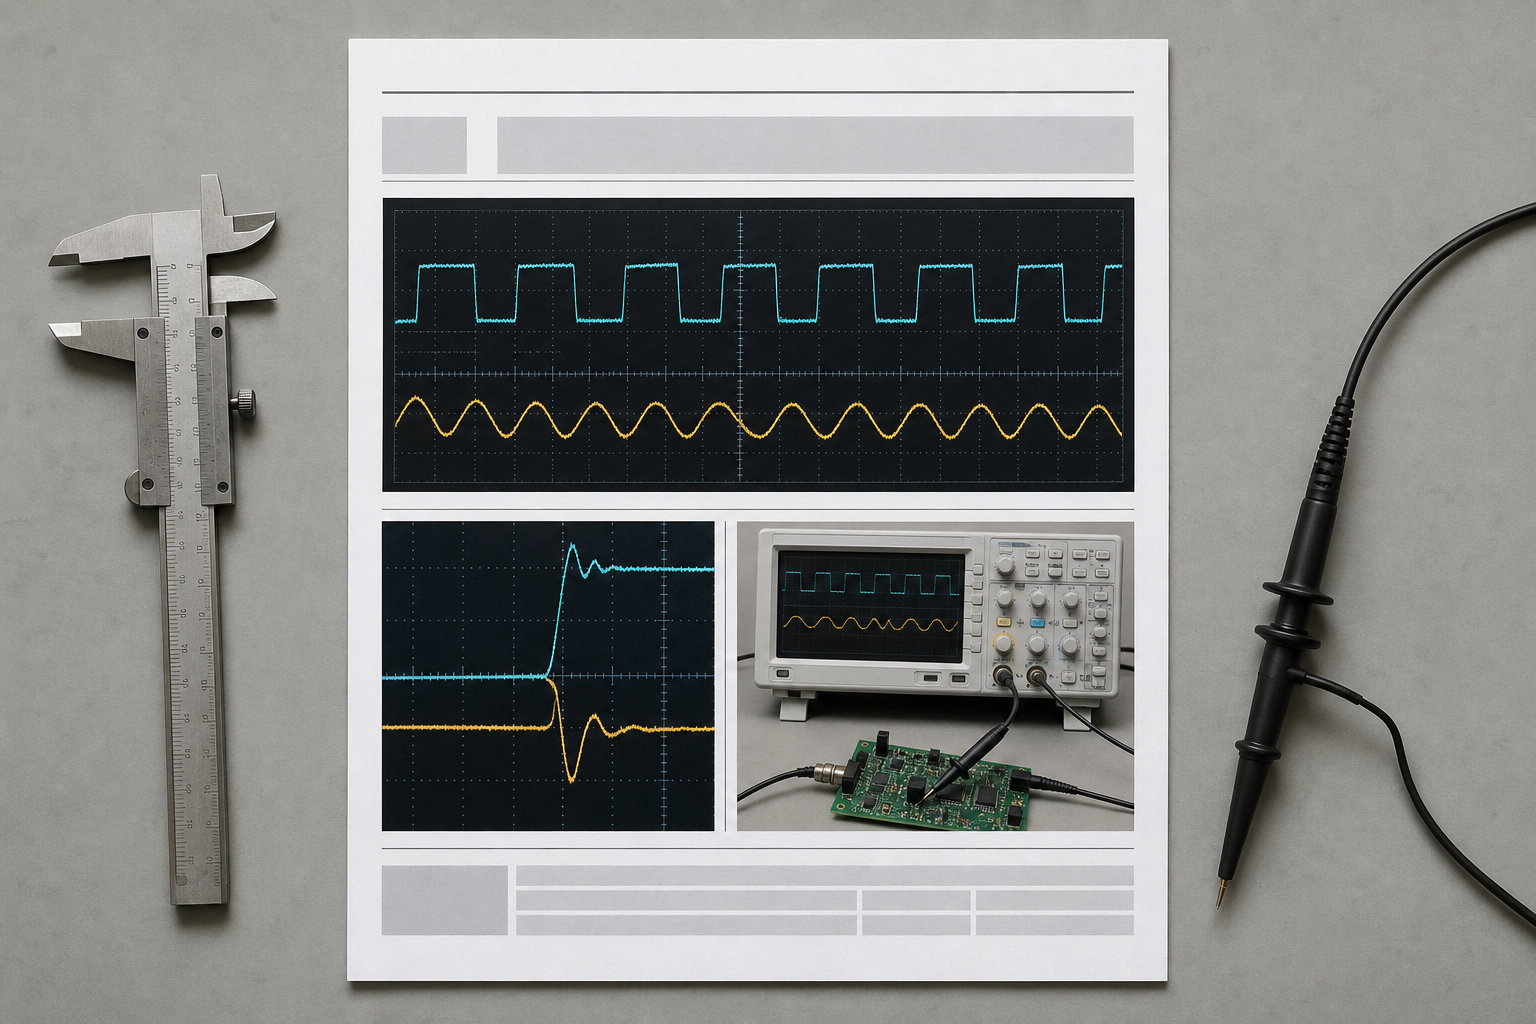
A strong evidence page usually contains three complementary views:
- A context photograph showing the instrument, device under test, and relevant probe connection.
- A corrected screen crop showing the complete display and settings.
- A closer crop or annotated copy highlighting the diagnostic feature.
Place the images in the order a reviewer needs them. Begin with context, move to the complete measurement, and finish with the detailed finding. Captions should state what was measured, where it was measured, and when in the test sequence the image was captured.
A useful caption might read: “Unit 184, test point TP7, channel 1 at 500 mV/div, captured after 20 minutes at operating temperature.” Avoid captions that merely say “oscilloscope result.”
If several photographs belong to one incident, assemble them into a consistent document with the image-to-PDF tool. Check page order, orientation, margins, and caption legibility before sending the report. Retain the individual images because PDF conversion may resample them.
Use consistent before-and-after comparisons
Before-and-after images are only persuasive when the capture conditions are comparable. Keep the following settings stable whenever the test permits:
| Item | Why consistency matters |
|---|---|
| Probe and test point | A different connection may show a different signal |
| Probe ratio and coupling | Scale and waveform shape can change |
| Vertical and horizontal scale | Visual differences may be exaggerated or concealed |
| Trigger configuration | Event position and stability depend on it |
| Acquisition mode | Averaging can suppress visible noise |
| Camera exposure | A brighter trace may merely be a photographic difference |
| Crop and output size | Matching geometry makes comparison easier |
When a setting must change, document it plainly. For example, a repaired signal may require a different vertical scale because its amplitude returned to specification. That does not invalidate the comparison, but the reviewer must be able to see the difference.
Do not copy a trace from one image into another, align waveforms by deforming them, or remove noise selectively from only the “after” image. Apply equivalent photographic corrections to both sides.
Perform a final integrity audit
Review the prepared files as if you were receiving the report without access to the bench. A short audit catches most avoidable failures.
Measurement integrity
- Is the trace shape consistent with the original?
- Are scales, trigger settings, units, and channel identifiers visible?
- Has any glare removal crossed a measurement region?
- Are OCR-derived values checked against the image?
- Are annotations stored separately from the clean version?
Image quality
- Are the screen edges rectangular without unnatural stretching?
- Do thin grid lines remain continuous?
- Are decimal points and engineering prefixes readable?
- Has sharpening created halos or false trace edges?
- Does compression preserve subtle noise and ringing?
Report context
- Is the unit or case identifier included in the filename or caption?
- Does the image show the correct test stage?
- Can the reader connect the display crop to the physical setup?
- Are before-and-after settings comparable or documented?
- Are unrelated personal or customer details excluded?
Delivery
- Does the PDF open correctly on another device?
- Are pages in the intended order and orientation?
- Can the images be inspected at normal report zoom?
- Are original captures retained outside the edited report package?
- Are filenames understandable without opening every file?
The conservative standard produces better evidence
The best oscilloscope image cleanup is usually quiet and limited. Correct perspective, reduce distracting glare, balance exposure, preserve the complete measurement context, and resize with care. Stop when further editing would require guessing what should be present.
A clear service report does not need cinematic instrument photography. It needs a trace that remains faithful to the capture, settings that a second technician can read, and enough context to connect the image to the tested unit. When those elements are preserved, a simple screen photograph becomes durable technical evidence rather than a decorative attachment.